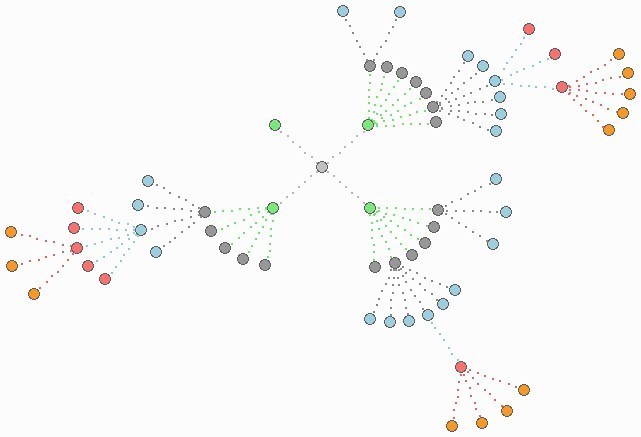
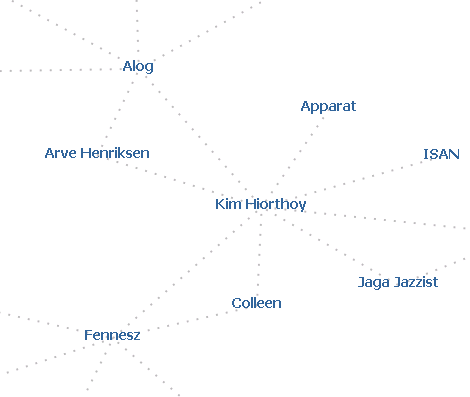
Bookmark with del.icio.us submit Tutorial%3A%20Building%20a%20Snowflake%20Graph%20from%20XML digg.com reddit

Tutorial: Building a Snowflake Graph from XML

JSViz 0.3.3 includes a few examples to help you get started. In this tutorial, I'm going to go over one of them. We'll create a Snowflake Graph from the contents of an XML file. You can find the example source, with comments based on this tutorial in the 0.3.3 Distribution.

Here's the final product

1) Start with a new HTML file

Add appropriate JSViz imports and an empty "init()" function body:

<html>
  <head>
    <script language="JavaScript" src="../geometry/SnowflakeGraphModel.js"></script>
    <script language="JavaScript" src="../layout/graph/SnowflakeLayout.js"></script>
    <script language="JavaScript" src="../layout/view/HTMLGraphView.js"></script>
    <script language="JavaScript" src="../layout/view/SVGGraphView.js"></script>

    <script language="JavaScript" src="../util/Timer.js"></script>
    <script language="JavaScript" src="../util/EventHandler.js"></script>

    <script language="JavaScript" src="../io/DataGraph.js"></script>
    <script language="JavaScript" src="../io/HTTP.js"></script>
    <script language="JavaScript" src="../io/XMLTreeLoader.js"></script>

    <script language="JavaScript">
      function init() {

      }
    </style>
    <style type="text/css">
      body { margin: 0; padding: 0; }
    </style>
  </head>
  <body onload="init()">
  </body>
</html>

2) Create a new SnowflakeLayout

You can create your graph in virtually any HTML element. If you're going to place the graph in an element other than the <body>, remember that the element must have a known size and position (via element.offsetWidth, element.offsetHeight, element.offsetTop, element.offsetLeft). Append the following to "init()"

var layout = new SnowflakeLayout( document.body, true );

3) Configure the layout

A configuration defines how we handle the addition of different kinds of nodes to the graph. For each "type" of node, we tell the layout how to create a "model" and "view" of the new node.

layout.config._default = {
  model: function( dataNode ) {
    return {
      childRadius: 40,
      fanAngle: dataNode.root ? 360: 100,
      rootAngle: 0
    }
  },

The model attribute in this configuration dictates the underlying structure of our graph. For a SnowflakeModel, we need to define the following for each node:

  • childRadius: the edge length to this node's children
  • fanAngle: the maximum angle in which child nodes will be layed out
  • rootAngle: the base angle of the graph at the origin (this is automatically determined for all child nodes)

These parameters determine how this new node will interact with other nodes in our graph. The "model" attribute of a class in our configuration must return a JavaScript Object containing these values.

  view: function( dataNode, modelNode ) {
    if ( layout.svg ) {
      var nodeElement = document.createElementNS("http://www.w3.org/2000/svg", "circle");
      nodeElement.setAttribute('stroke', '#888888');
      nodeElement.setAttribute('stroke-width', '.25px');
      nodeElement.setAttribute('fill', dataNode.color);
      nodeElement.setAttribute('r', 6 + 'px');
      nodeElement.onmousedown =  new EventHandler( layout, layout.handleMouseDownEvent, modelNode.id )
      return nodeElement;
    } else {
      var nodeElement = document.createElement( 'div' );
      nodeElement.style.position = "absolute";
      nodeElement.style.width = "12px";
      nodeElement.style.height = "12px";
        
      var color = dataNode.color.replace( "#", "" );
      nodeElement.style.backgroundImage = "url(http://kylescholz.com/cgi-bin/bubble.pl?title=&r=12&pt=8&b=888888&c=" + color + ")";
      nodeElement.innerHTML = '';
      nodeElement.onmousedown =  new EventHandler( layout, layout.handleMouseDownEvent, modelNode.id )
      return nodeElement;
    }
  }
}

The view defines what the nodes in our graph look like. The view attribute of a configuration class must return a DOM element -- JSViz supports most HTML and SVG elements. You can control the appearance and behavior of view elements just like any DOM element. For more details, see the comments in the example source.

4) Override the default edge properties.

This is optional, of course. The SnowflakeLayout provides a default implementation, but let's replace it with a custom edge builder that draws edges in the color of the parent node.

layout.viewEdgeBuilder = function( dataNodeSrc, dataNodeDest ) {
  if ( this.svg ) {
    return {
      'stroke': dataNodeSrc.color,
      'stroke-width': '2px',
      'stroke-dasharray': '2,4'
    }
  } else {
    return {
      'pixelColor': dataNodeSrc.color,
      'pixelWidth': '2px',
      'pixelHeight': '2px',
      'pixels': 8
    }
  }
}

5) Instantiate a loader to process the contents of our file.

The XMLTreeLoader is included in the JSViz distribution. It builds a simple graph based on the hierarchical structure of an XML document.

var loader = new XMLTreeLoader( layout.dataGraph );
loader.load( "treedata1.xml" );

See the XML source here

For your own projects, you may write a custom loader that reads XML, JSON or other formatted data from a file or REST interface.

6) Create a builder to add all of the nodes to the graph once we've finished reading the file.

var SimpleBuilder = function() {
  this.started = false;
  this.update = function() {
    var d = layout.dequeueNode();
    if ( !this.started && d ) {
      this.started=true;
      while( layout.dequeueNode() ) {};
    }
    if ( this.started && !d ) { return false; }
  }
}        
var buildTimer = new Timer(0);
buildTimer.subscribe( new SimpleBuilder );
buildTimer.start();

Check out the example source contains an alternate strategy for adding nodes.

We're finished. Take another look at the product.

So what can you do with JSViz 0.3.3? While we' post more examples and tutorials over the coming days and weeks, we encourage you to share your projects, ideas, and suggestions.

Trackback

TrackBack URL for this entry:
http://www.jsviz.org/cgi-bin/mt/mt-tb.cgi/5

Comments

Hi Kyle,

I've been playing with the new jsVis. Great job!

I'm now trying to add some text on a mouseOver, but am not sure how to go about doing this. I've read up on SVG, but it seems like you've created a system of callbacks to manage the nodes.

Any suggestions?

Eric

Hey Eric, is it just plain text that you're adding or do you need to control formatting and markup? SVG text nodes (or the subset supported by Firefox) are currently a bit limited: no line wrapping, rich formatting, or anchors. Let me know and I can post a quick example.

Hey Kyle,

I found your library and tutorial quite useful (and fun to play with). I saw your Visual Thesaurus alternative and was impressed. Because it didn't work very well in Konqueror (many AJAX scripts fail in Konqueror), I decided to make one that does not use AJAX -- http://www.inportb.uni.cc/wordmap/

It was originally done with jsviz 0.3.2, which worked in all browsers that it was tested in. 0.3.3 does not work very well in MSIE (the examples did not work very well either). The graph is drawn correctly, but an error is triggered when you try to drag a node. I thought you might want to know.

Jiang, Great! I've actually been working on an update to the Visual WordNet demo, myself -- There's a lot of interest in using it for foreign and cross-language WordNets. I'm basing the new work on a demo that I put together before releasing JSViz 0.2:

http://kylescholz.com/projects/tree/wordnet2.html

(it's old and incomplete ... sorry)

I should be done with the new version, based on JSViz 0.3.3, in a week or so and I'd like to compare notes. If there's enough interest, I'd like to spin this off into an independent opensource project.

Also, I've had some great feedback on the 0.3.3 release and I plan to post an update with fixes for known browser compatibility issues -- I'll post about this as soon as it's available. I'm also aware of the buggy IE7 behavior of the music-matching demos from my site. Somewhere on my todo list, I'm planning to update these and fix these issues (...much too do!).

Thanks for the useful feedback and helpful resource. I hope to make a gallery available shortly to promote projects like yours.

Thanks for your response! You've quite an elaborate GUI there, and I would expect no less from a master like you =]

I was actually intending to make a Chinese language version, but found that there are so many other languages available too.

You probably saw that my implementation was based on your idea of using XML to transfer data -- it is generated by the wordnet parser, and passed to Jsviz. If you used IE to view my implementation, you would be directed to Jsviz 0.3.2, in which the xml loader was modified to allow all attributes to be passed. Other viewers would see Jsviz 0.3.3, in which your xml loader already does that. I was thinking that the Jsviz session could be enclosed in an inline frame in the GUI. I suppose I'll keep going in this direction, and see what other interesting data I can pass to the "centralized" Jsviz.

But yeah, I love your new design! Thanks for making this awesome package available!

hey kyle, i love the script!! I'm not sure if my post went through, so i'm writing it again:

i am currently a graduate student in architecture working on my thesis project.

For my thesis analysis, I am trying to create a matrix that will list certain definitions, qualities and criteria of spatial analysis in order to show 3 dimensional relationships. I would like to set it up in a snowflake type diagram similar to the one that you have created. however, i would need for the children from one family to intersect with nodes of another family allowing the graph to fold onto itself. for example: if i pull up a primary node on social space, its characteristics will come up along with requirements for the definition as well as the case studies i have done/philosophies/theories.

i am completely new to scripting and definitely need some help.

thanks,
aaron
acohen22@student.scad.edu

Hey Aaron, I responded to your first post in the Comments, here. Thanks!

Great work Kyle. Building on Eric's question I have been trying to add text too. For both nodes and lines any example you could give would be great. I can build an xml file based on router topology but I can't label the routers or the circuits.

Thanks
Kyle Bowerman

Hi Kyle. Do you plan to implement this mouseover text as HTML or SVG? With HTML, it's pretty easy to add tooltip-like functionality to your nodes and control the appearance with CSS. This is a very common request, and I've probably agreed to implement an example a dozen times. I'll see if I can put something together when I have a moment over the next few days.

Edges are less simple, because I haven't implemented any hooks to attach events, but this isn't an unreasonable request. I'll give this some thought and consider adding it as a feature request.

Thanks for the quick reply Kyle. How is your new life at google? I am planning on using my "labels" for node and edges on svg not html. I would prefer not to use mouse over because I would like all the labels of the nodes to appear. The thought was that you could select one seed router and draw only it's neighbor from a topology file or direct discovery. Then by mousedown on a neigbor you would add its new neigbors. I must clarify that I would like to label both the connector (circuit) and the ends of the connector (interfaces) and the nodes router name. I was able to do this with graphviz but would like to abondon that for jviz. Thanks again this is a wonderful package.

Hi Kyle.

I'm having problem with the script. Maybe I'm doing something wrong because I cant get it to work. The script only does the initialization of the snowflakeLayout and the XML parse, none of the configuration (model, view). What I'm I doing wrong?

Thanks for the help
Kind Regards Samyar

The link "0.3.3 Distribution" is to http://www.jsviz.org/wiki/index.php/Download
but
The requested URL /wiki/index.php/Download was not found on this server.

Jsviz is great! Thanks for a great piece of software!

Post a Comment

(optional)
(optional)


Project Blog